The Hidden Mathematics of Software Maintenance: Why Your Codebase Stops Growing
 Ever wonder why software projects start fast and inevitably grind to a halt? Why adding more developers doesn’t speed things up? Why some codebases hit an invisible wall while others keep growing for years?
The answer is math. Specifically, the same math that governs population dynamics in ecology. Every software project has a carrying capacity: a maximum sustainable size determined by language choice, team structure, and maintenance practices. It’s not a metaphor. It’s a differential equation, and it doesn’t care about your sprint planning.
The Feature Factory Paradox
Every development team knows this feeling: explosive initial growth, then inexorable slowdown. Features that took days now take weeks. Simple changes cascade into refactors. The team works harder and delivers less.
This isn’t a failure of process or people — it’s mathematical inevitability. Software development follows the same logistic growth patterns you find in bacterial colonies and forest ecosystems. The difference is we can measure it, model it, and (maybe) plan for it.
Features vs. Maintenance
Two forces, one team:
- Feature Development: Adding new capabilities, building business value
- Maintenance Work: Fixing bugs, refactoring code, managing technical debt
Every developer-hour on maintenance is an hour not spent on features. Every feature added without maintenance creates compound interest on technical debt. This creates a mathematical relationship that determines your project’s fate, whether you acknowledge it or not.
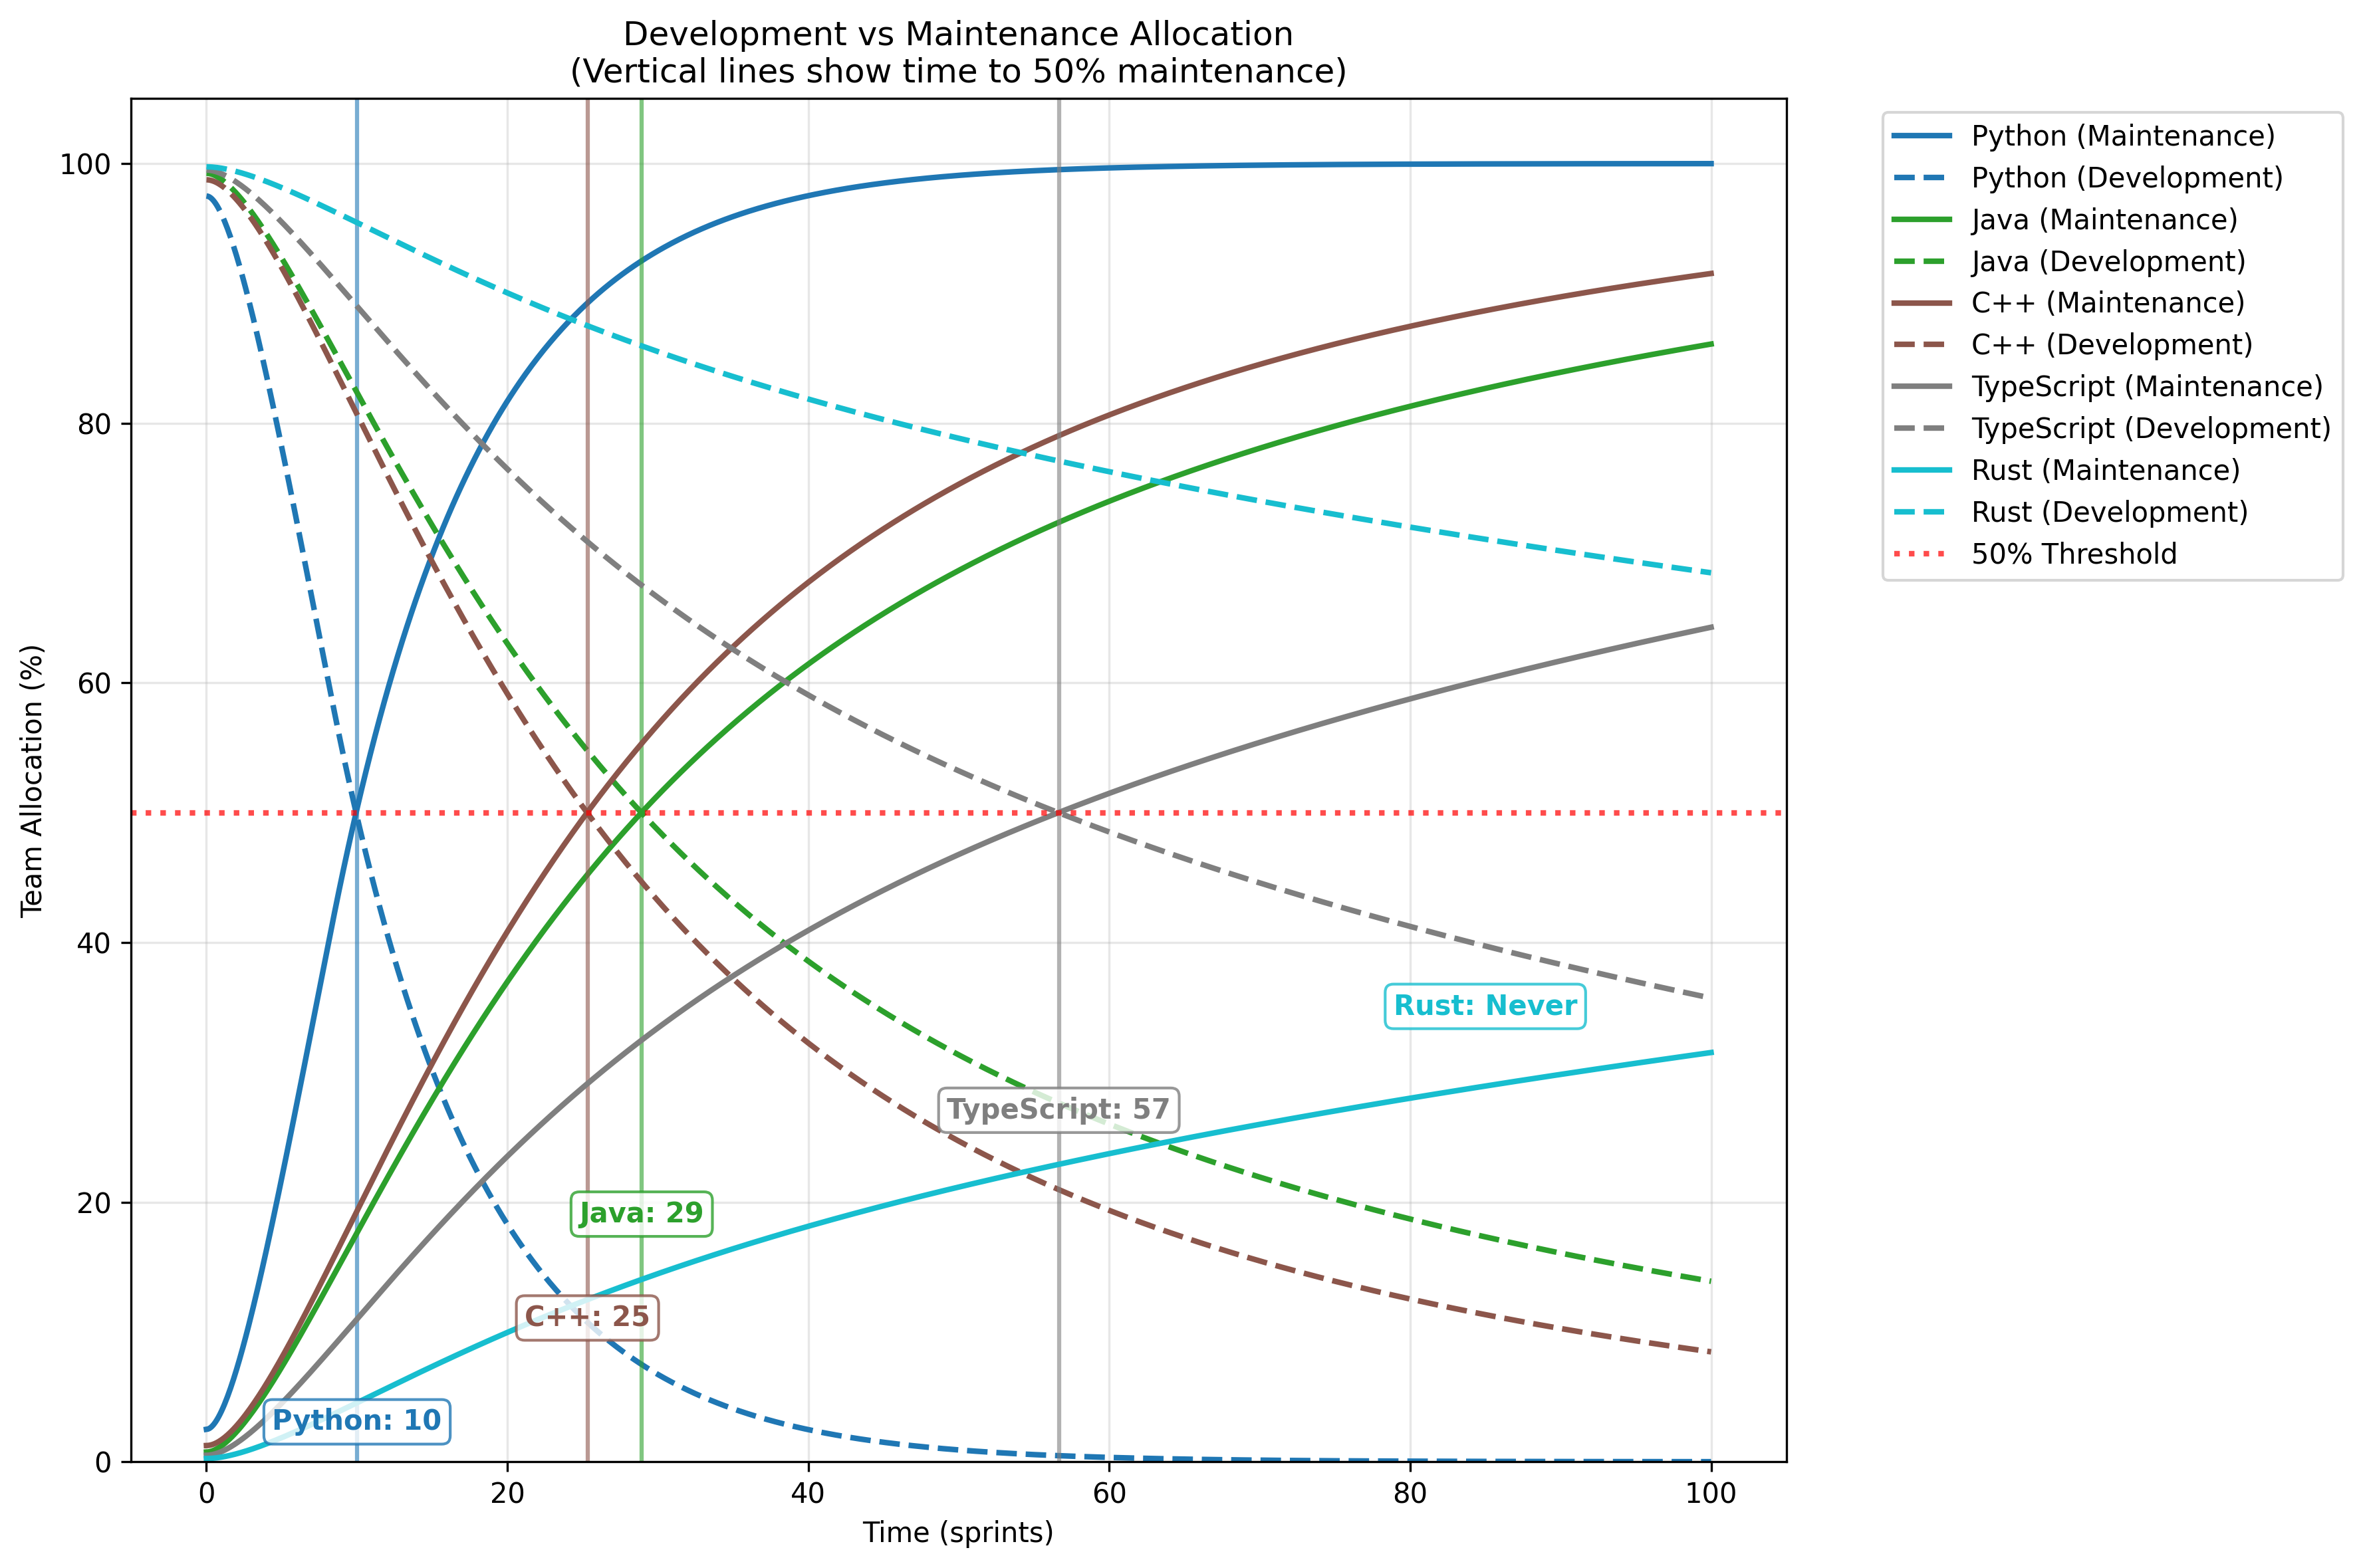
Notice the vertical lines — those mark when each language reaches the 50% maintenance threshold. Python hits this wall in 10 sprints (~5 months). Rust never reaches it. Let that sink in.
The Carrying Capacity of Code

In ecology, carrying capacity is the maximum population an environment can sustain. For software, it’s the maximum codebase size your team can maintain while still shipping features.
Depends on:
- Language maintainability: How much effort each line of code demands over time
- Development velocity: How fast you can ship initially
- Team structure: Communication overhead, knowledge distribution
- Architecture: Modularity, testing, documentation (all the stuff nobody wants to do)
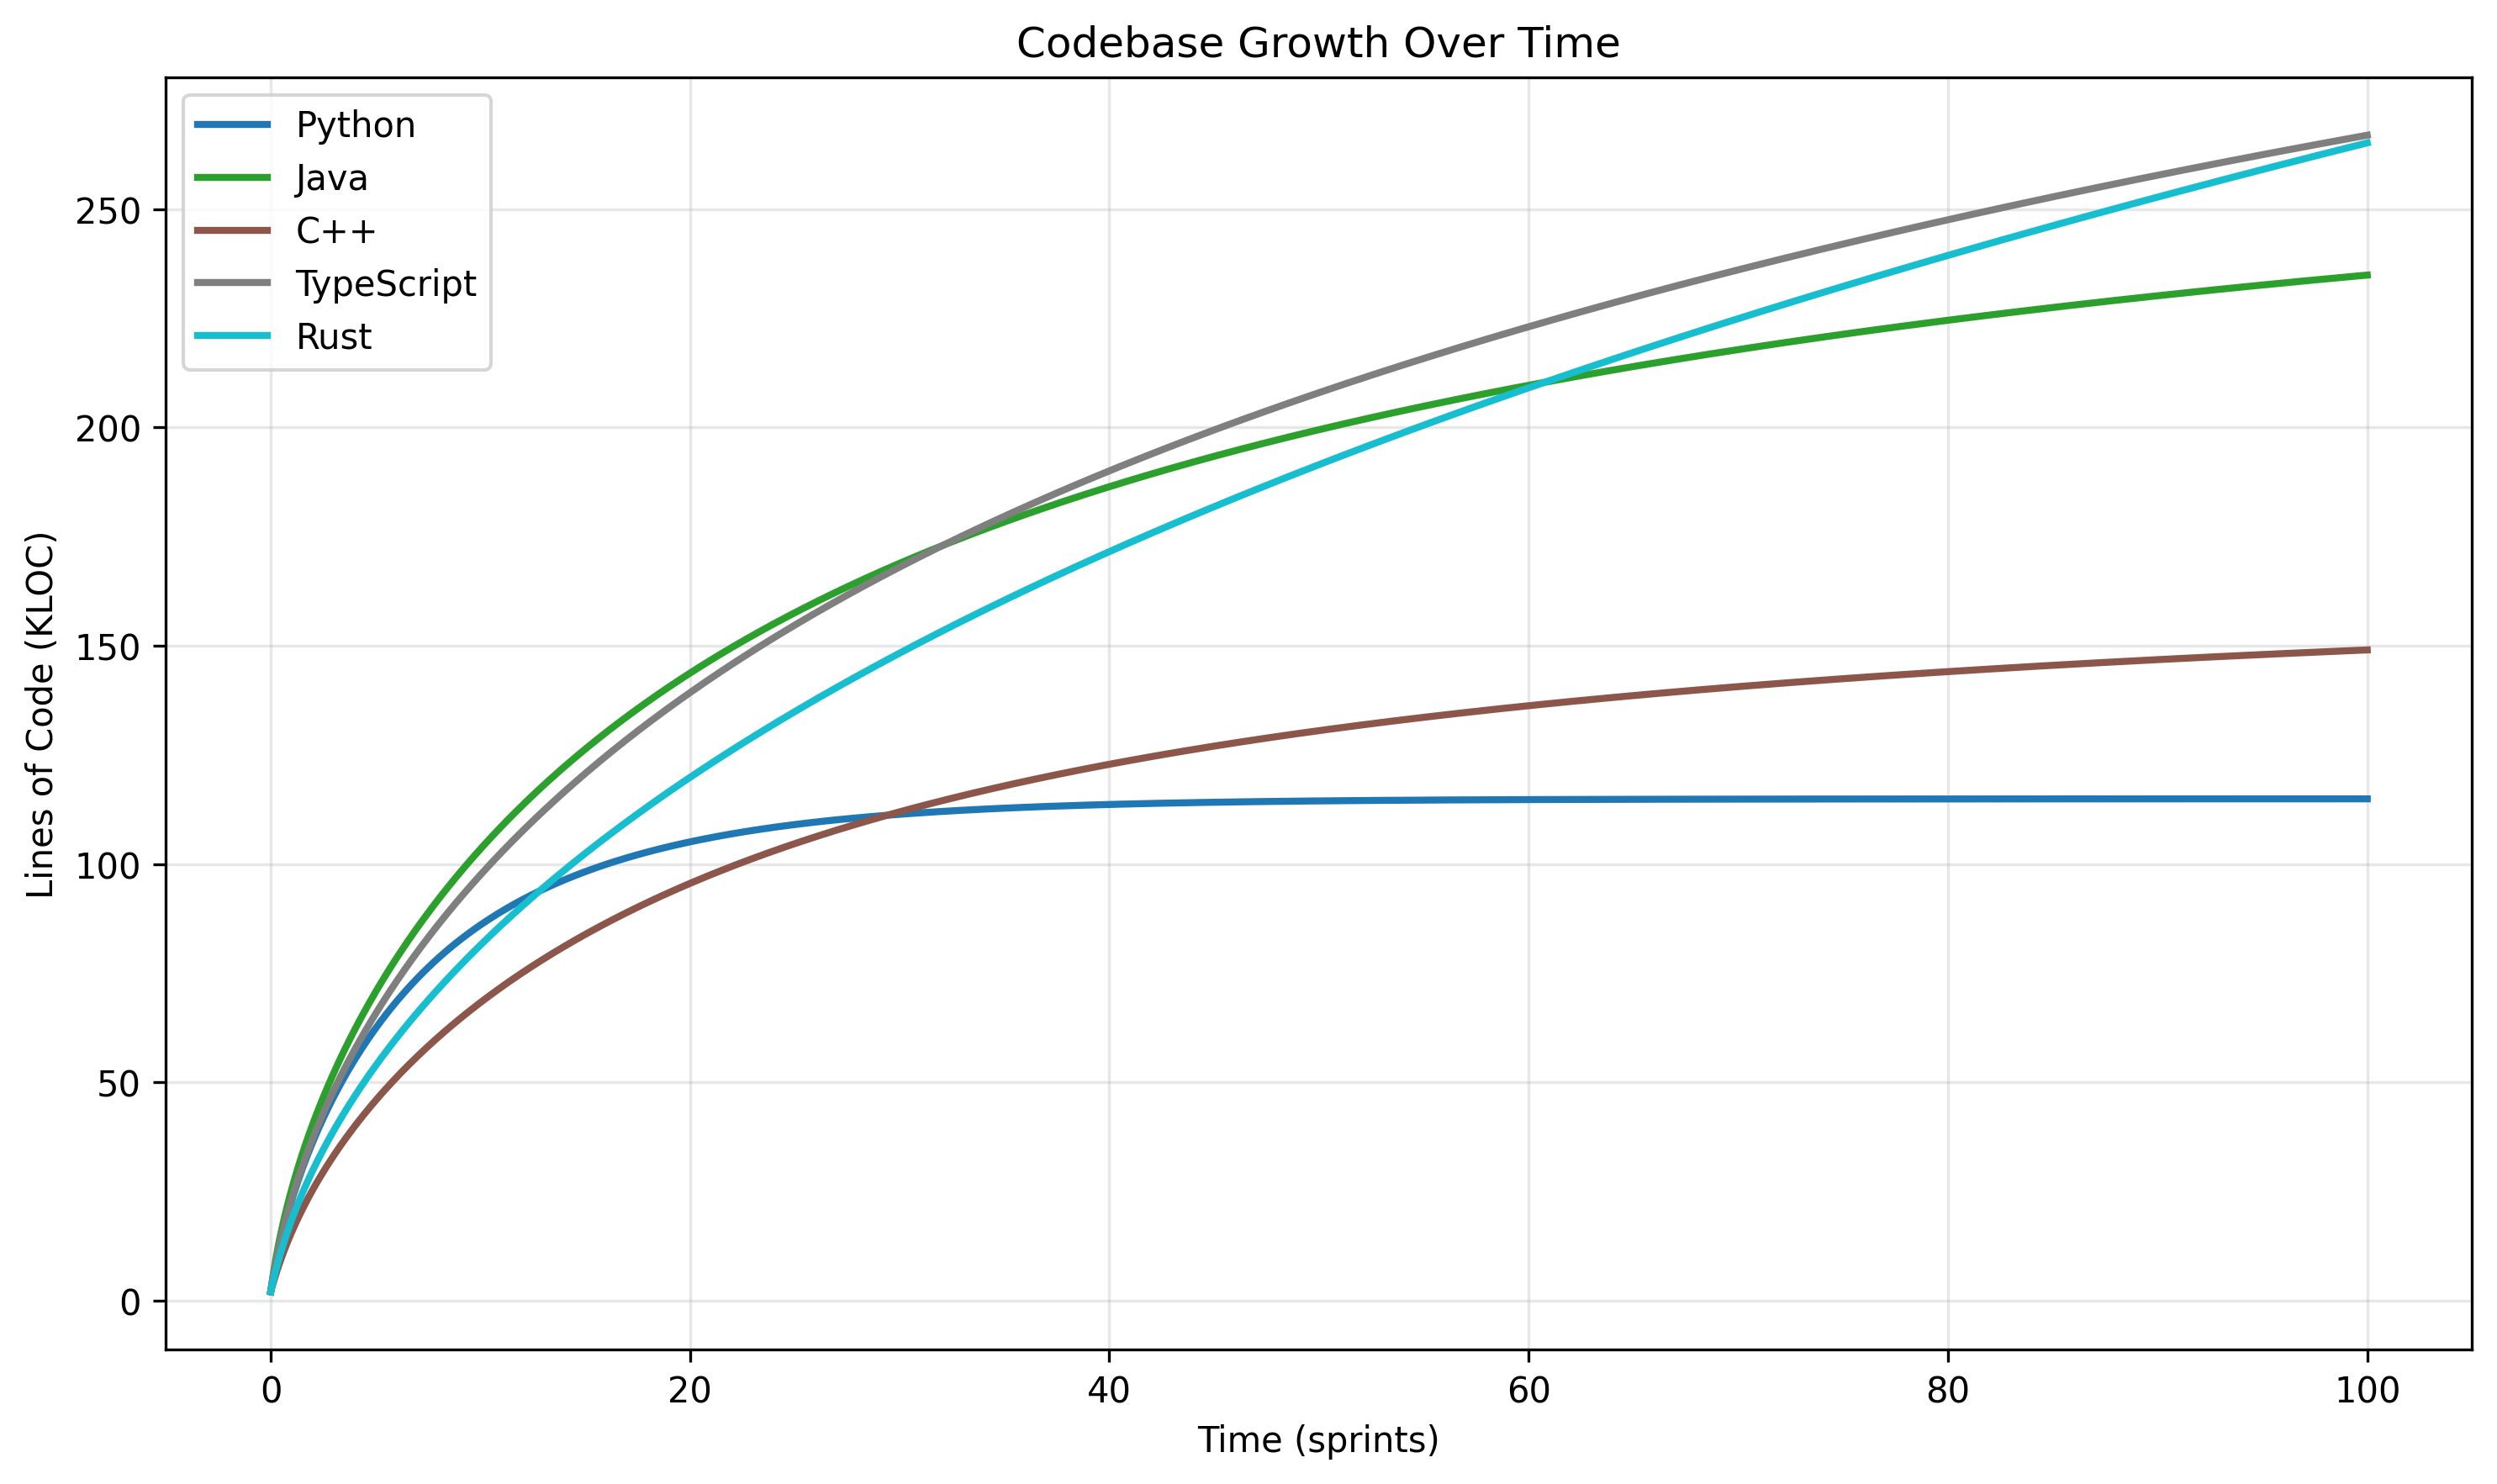
The math is surprisingly predictable. Each language plateaus where maintenance burden balances development capacity. Rust sustains 358 KLOC. Python plateaus at 114 KLOC. Not opinion. Math.
The Mathematics
I modeled software development as a system of coupled differential equations:
- L(t): Lines of code in thousands (KLOC)
- M(t): Maintenance hours required per sprint
The key insight: maintenance grows with codebase size, eventually consuming all available development time.
dL/dt = (development_hours / total_hours) × dev_speed × complexity_factor
dM/dt = (required_maintenance - current_maintenance) × adjustment_rate
Where required_maintenance = L(t) × language.maintenance_burden
Simple model. Remarkably realistic behavior. Captures the exponential slowdown that every real development team experiences but nobody wants to talk about in standups.
Language Design Matters — Mathematically
Different languages have vastly different maintenance characteristics:
- Python: 10.0 hours/KLOC/sprint — dynamic typing extracts its toll
- Java: 3.0 hours/KLOC/sprint — enterprise overhead but reasonable
- TypeScript: 2.0 hours/KLOC/sprint — type safety pays measurable dividends
- Rust: 1.0 hours/KLOC/sprint — designed for long-term sustainability
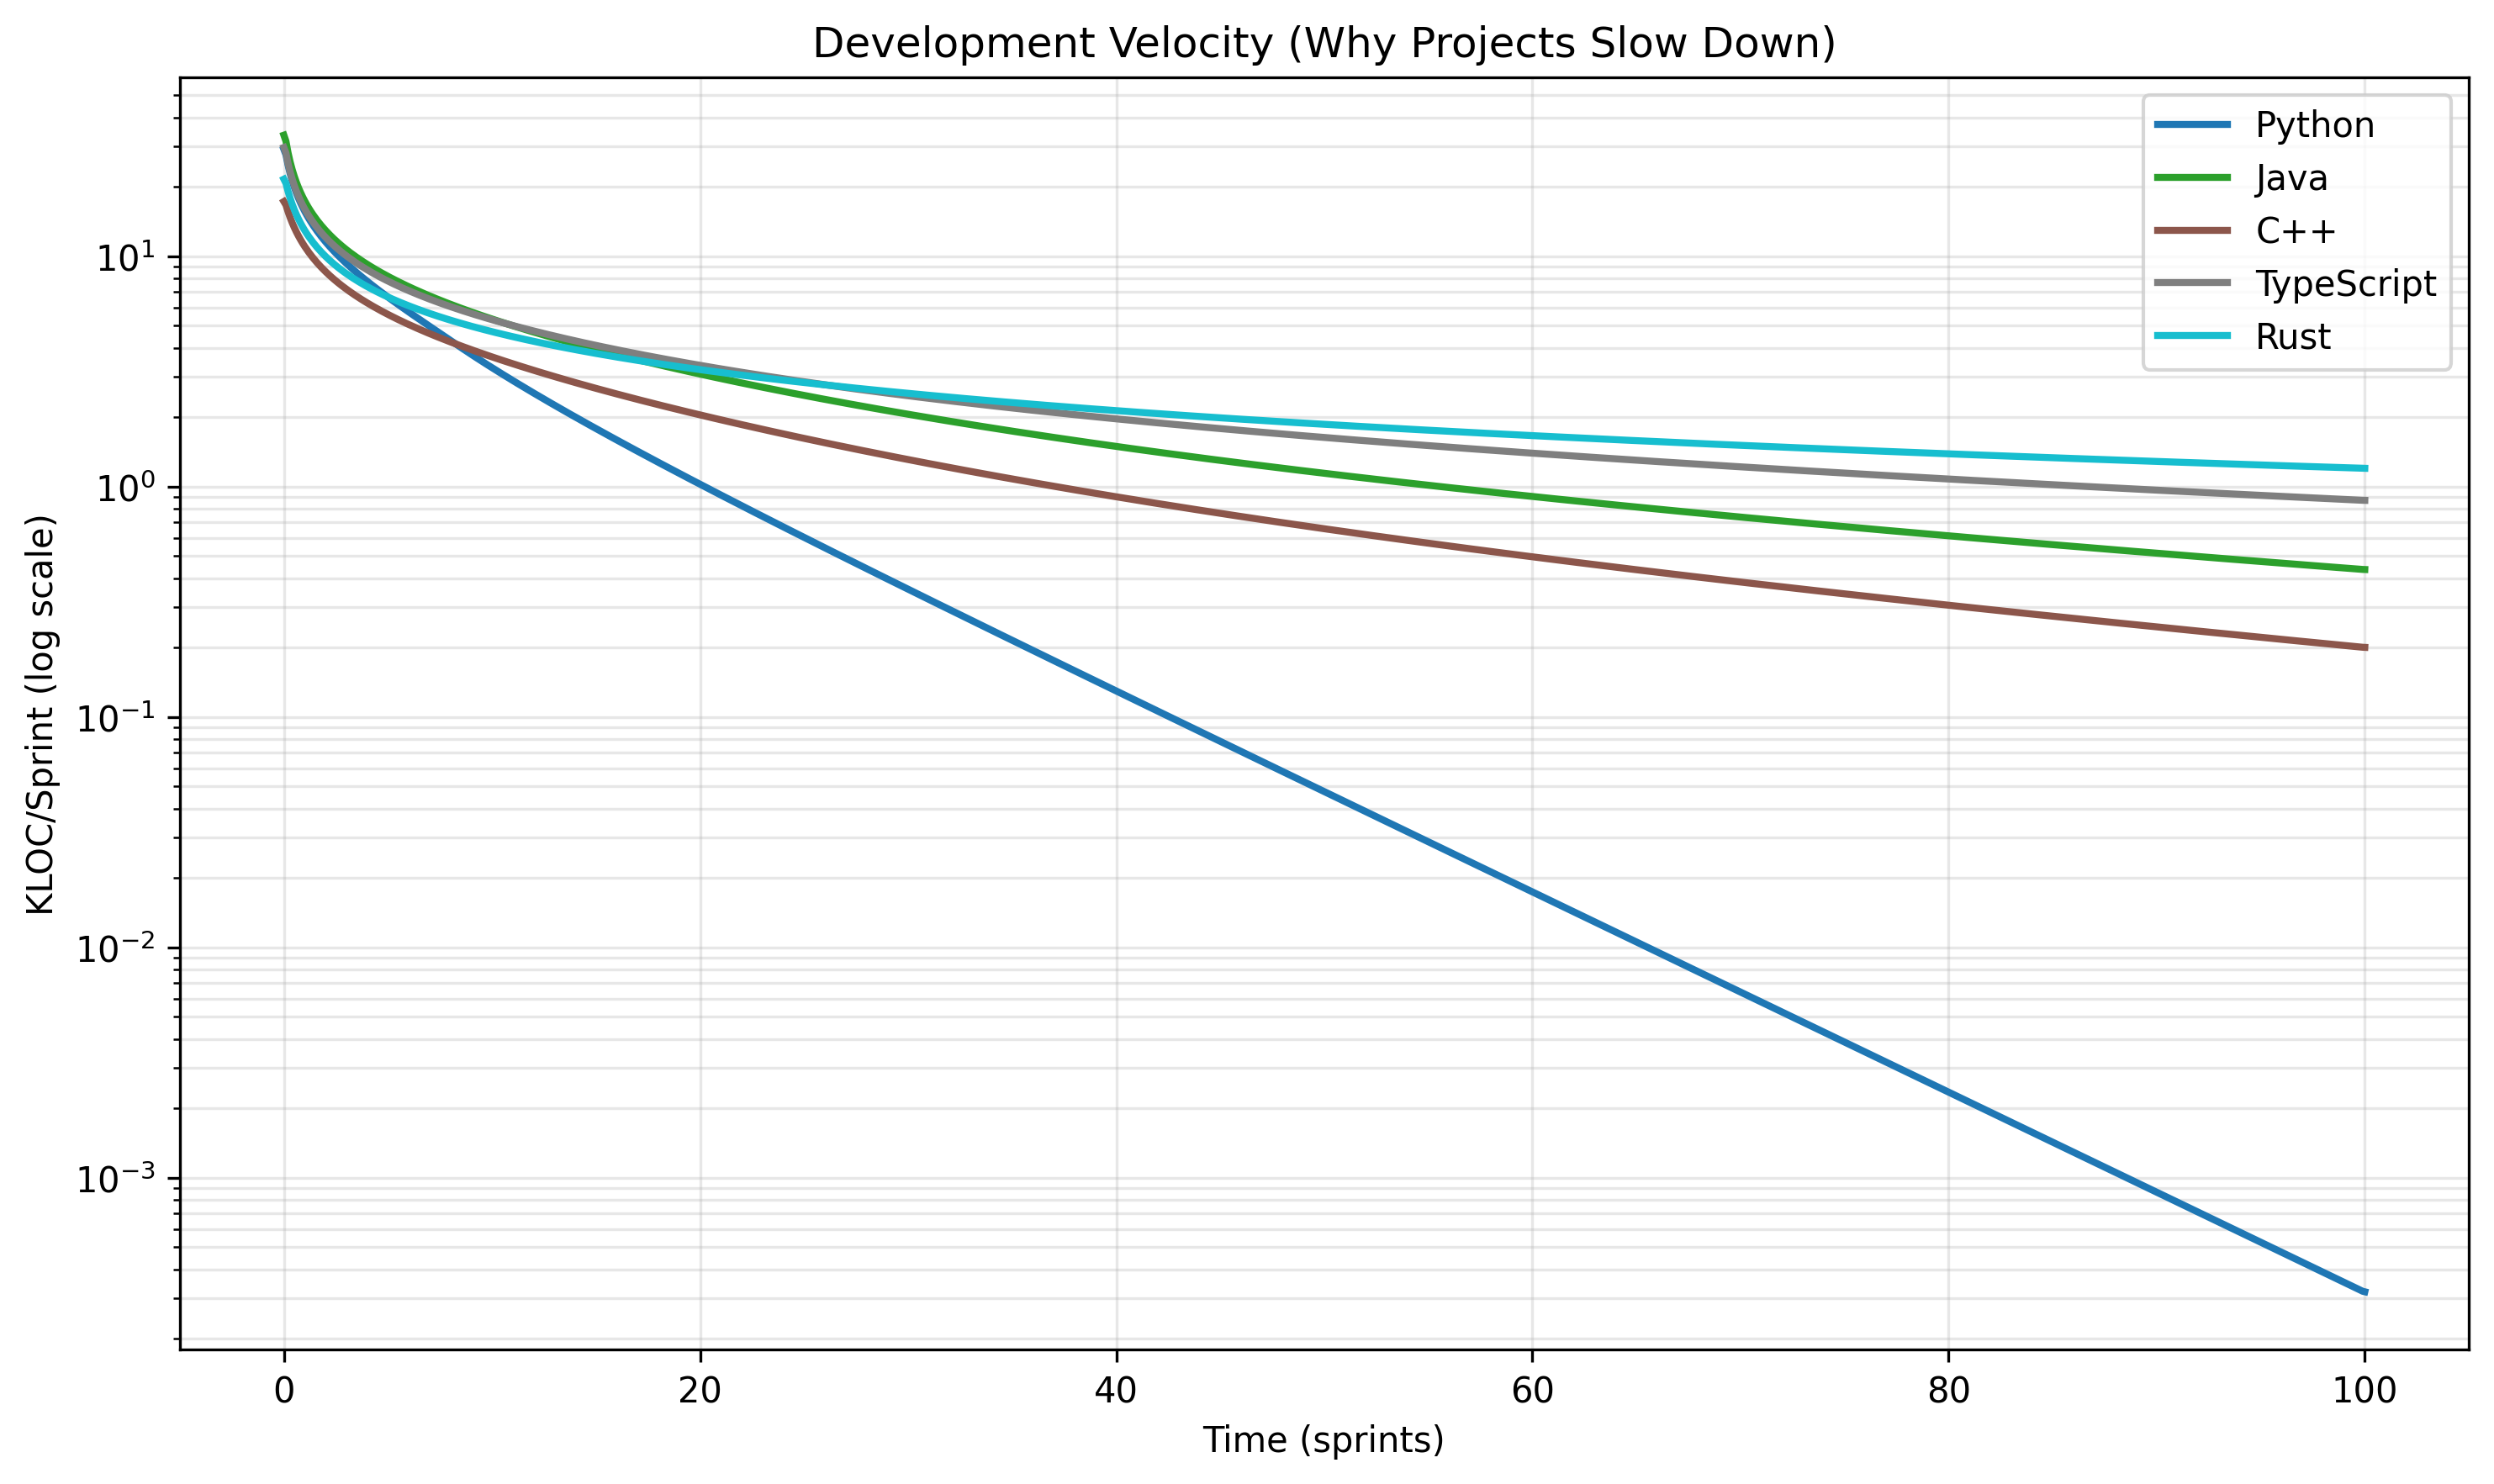
Log scale reveals the drama. Python’s exponential decline vs Rust’s sustained performance. This isn’t opinion — it’s a mathematical consequence of maintenance requirements. The “fast” language slows down. The “slow” language keeps going.
The Maintenance Crisis Timeline
How quickly projects hit the wall:
- Python: 10 sprints (~5 months) to 50% maintenance
- C++: 25 sprints (~1.3 years) to 50% maintenance
- Java: 29 sprints (~1.4 years) to 50% maintenance
- TypeScript: 57 sprints (~2.8 years) to 50% maintenance
- Rust: Never reaches 50% maintenance
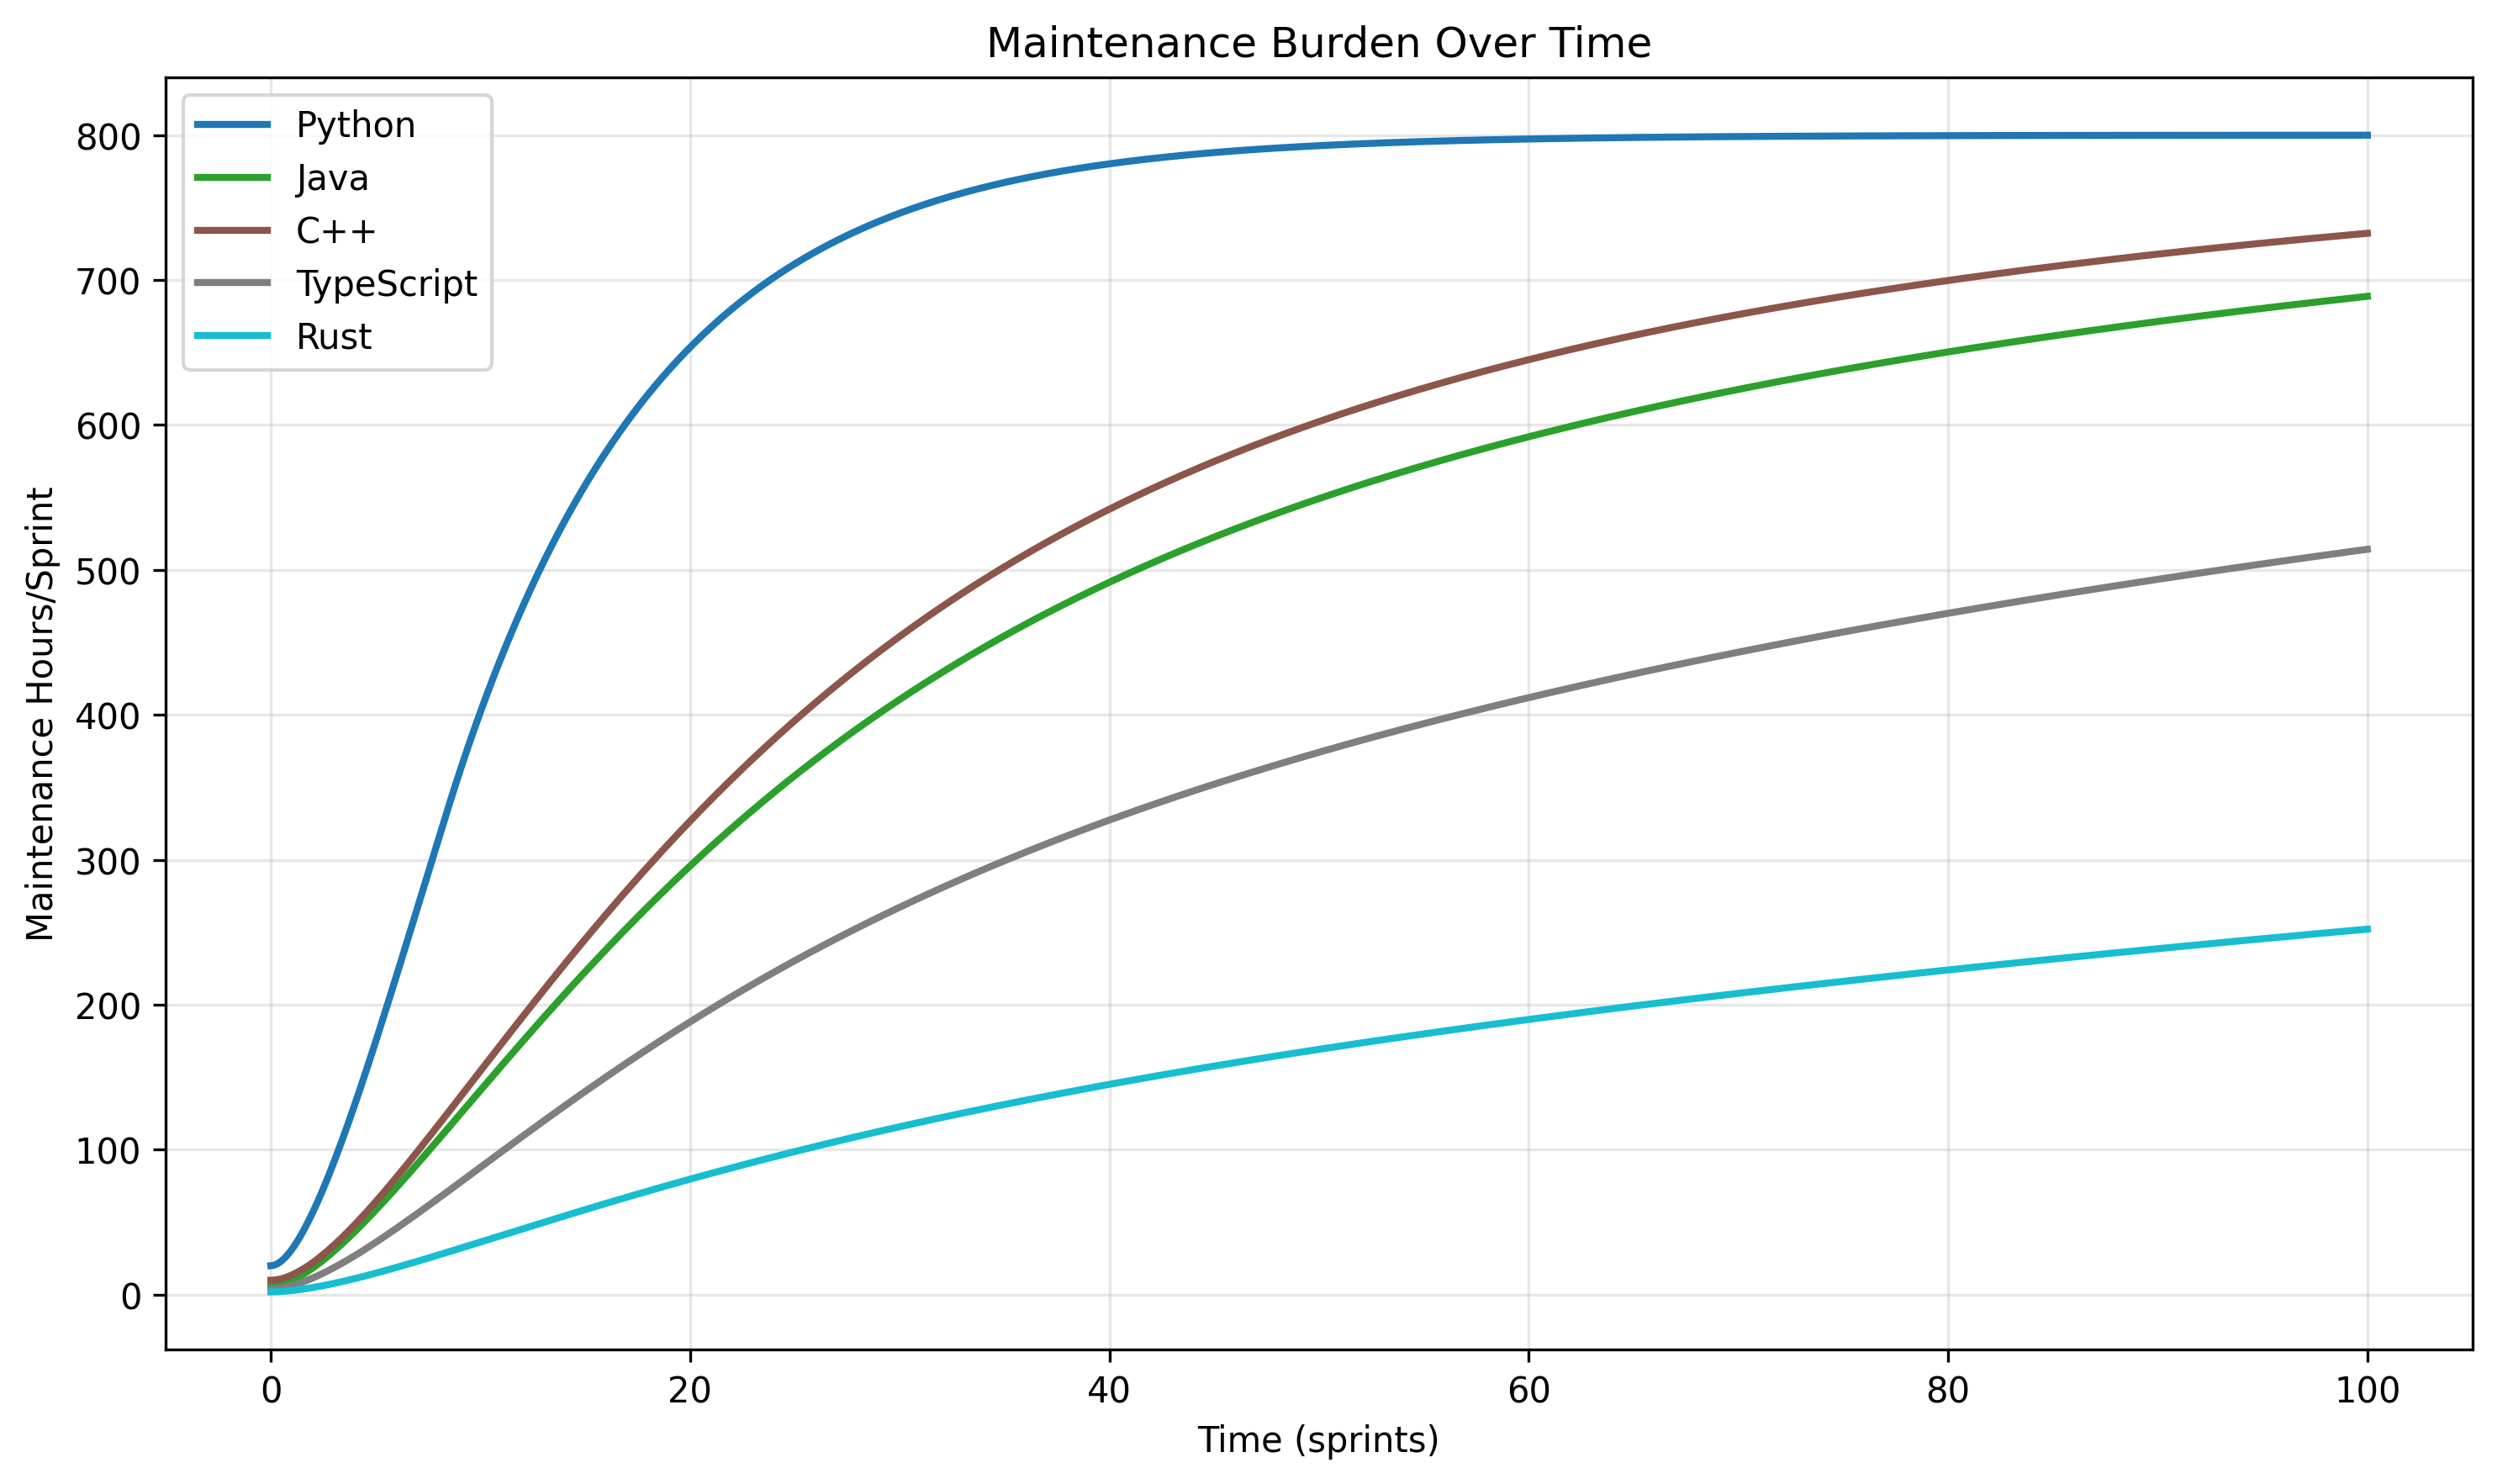
At 50% maintenance, teams spend more time fixing existing code than building new features. Beyond 80%, development effectively stops. I’ve watched this happen at multiple companies. The teams that survived were the ones who saw it coming.
What This Means
For engineering managers: Your velocity will decline mathematically. Plan for it instead of pretending it won’t happen. Rust codebases sustain growth 5x longer than Python codebases. That matters when you’re picking a language for a product that needs to last.
For developers: That “quick Python prototype” may become unmaintainable faster than you think. The maintenance burden you create today determines your team’s velocity next year. Choose accordingly.
For product teams: Velocity naturally declines. This isn’t your engineers slacking off — it’s mathematical reality. Plan roadmaps accordingly or prepare to be perpetually disappointed.
Feature Accumulation
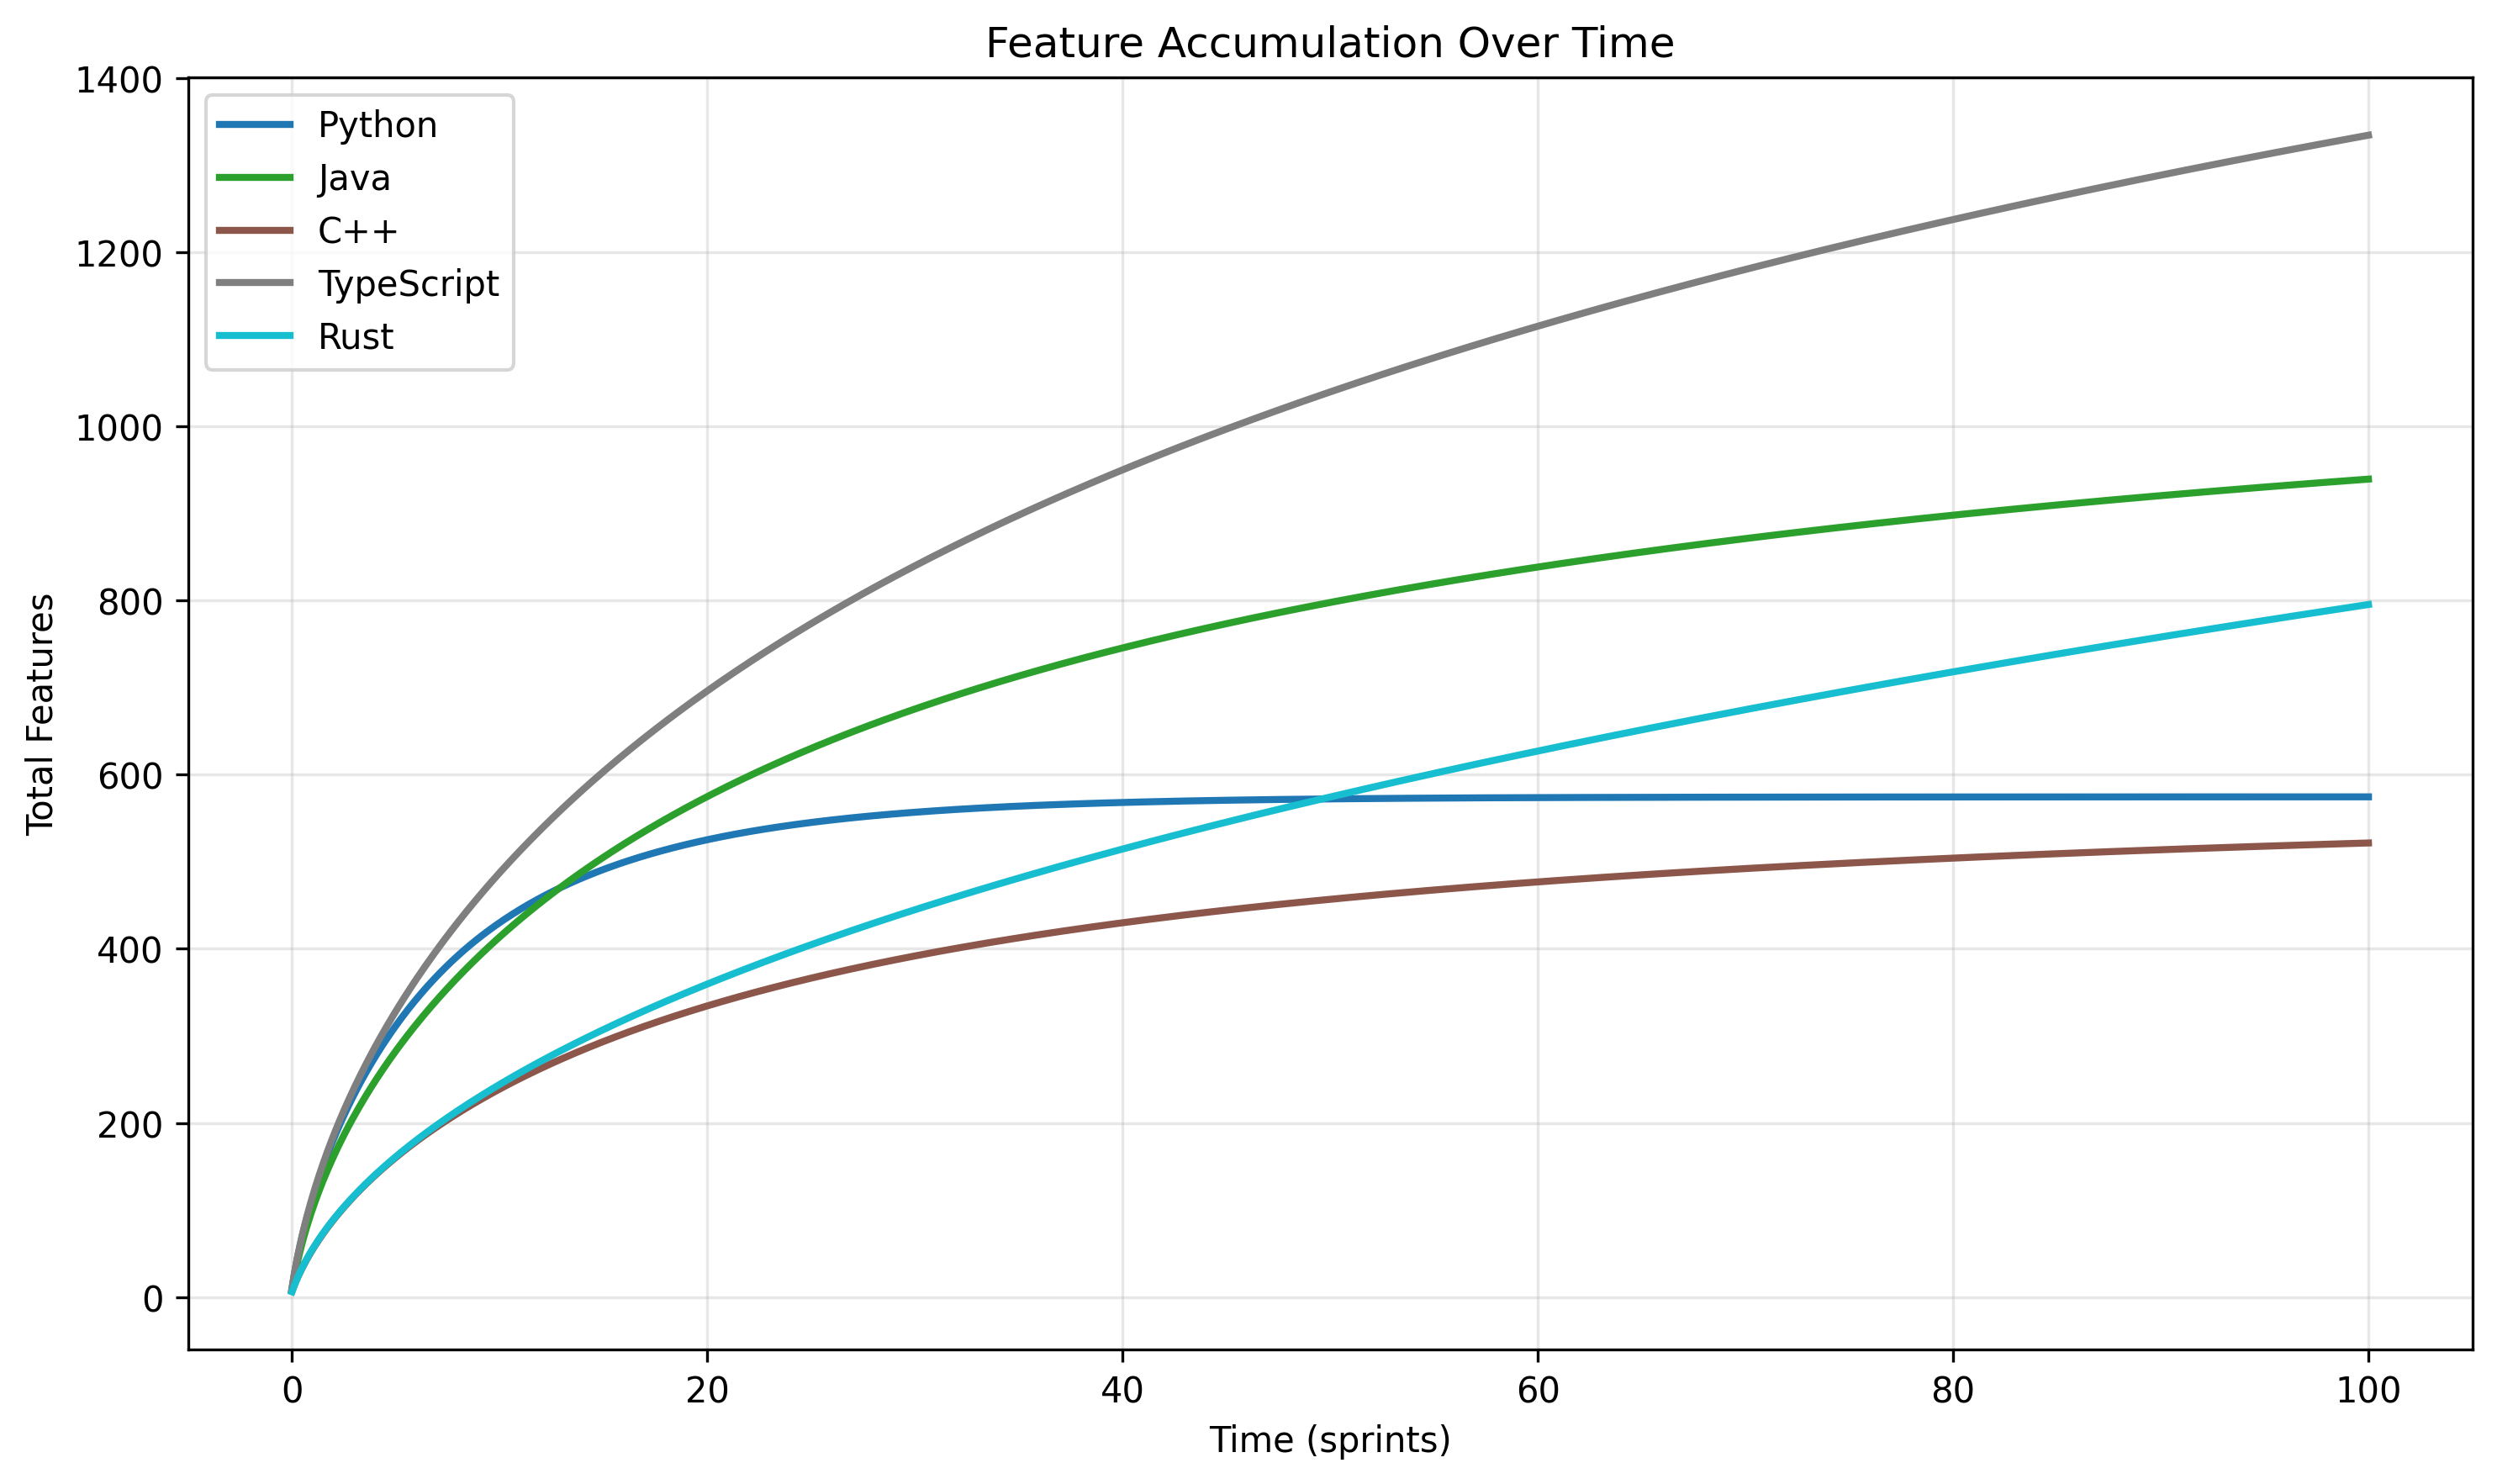
From a business perspective, what matters is total features delivered. TypeScript delivers 1,629 features sustainably. Python manages 572 before hitting its ceiling. The “faster” language delivers less value over time. Let that one marinate.
Breaking Through
Carrying capacity is mathematically inevitable but not fixed. You can push the limits:
Architecture — Microservices, modularity, clear interfaces reduce maintenance burden per line of code.
Tooling — AI-assisted development, comprehensive testing, automated refactoring shift the maintenance curve. (Yes, the irony of AI helping with the math of software maintenance is not lost on me.)
Language evolution — Rust represents a paradigm shift toward sustainability, designed with carrying capacity in mind.
Strategic debt management — Understanding the model helps optimize the features vs. maintenance trade-off. You can’t eliminate the math, but you can work within it intelligently.
The Model
The mathematical model is available on GitHub with all visualizations. Key metrics to track:
- Lines of code growth rate (dL/dt)
- Maintenance time percentage
- Feature velocity trends
- Time to 50% maintenance threshold
Your codebase will reach carrying capacity. The question is whether you’ll see it coming.
Complete mathematical model and visualizations in the GitHub repository. The model uses realistic industry data and can be adapted to your own projects.